Panda's pivot table function
July 30, 2024
So I was working on a single dataframe with data from a large number of countries covering various years. In a simplified form it looked like this:
| year | country | some column | another column |
|---|---|---|---|
| 2018 | Austria | some value | another value |
| 2018 | Belgium | etc | etc |
| 2018 | next country | etc | etc |
| 2018 | another country | etc | etc |
| 2019 | Austria | etc | etc |
This dataset turned out to be too complex to easily understand the situation for individual countries per year. If only the data could be regrouped in a meaningful way! The way to do this, is by using a pivot table in Pandas.
What does the pivot table do? It regroups the data and can perform an aggregation of the values of the selected column and presents it as a table that summarises the data in a meaningful way. Simplified, it could be something like this:
| year | Austria | Belgium | next country | another country |
|---|---|---|---|---|
| 2018 | 7 | 8 | 10 | 3 |
| 2019 | 12 | 18 | 20 | 6 |
| 2020 | 13 | 21 | 22 | 9 |
| 2021 | 15 | 28 | 23 | 12 |
| 2022 | 18 | 28 | 31 | 15 |
*the values are just examples
In Pandas the pivot table function works as follows:
- specify the dataframe and the names for the indexes, columns and values.
- include the type of calculation to be performed, such as count, sum, etc.
For example:
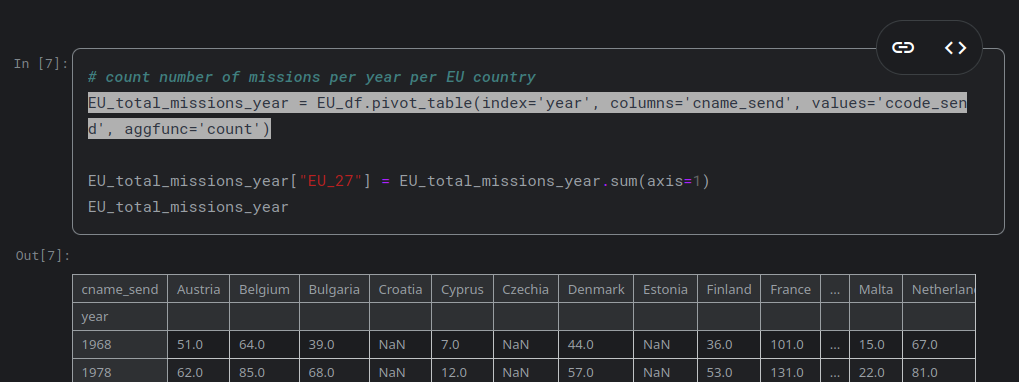
EU_total_missions_year = EU_df.pivot_table(index='year', columns='cname_send', values='ccode_send', aggfunc='count')
Here the dataframe is EU_df, the index is set to year, the countries (cname_send) become the columns and the count function aggregates the number of occurrences of the column ccode_send.
For some more examples, see my notebook here